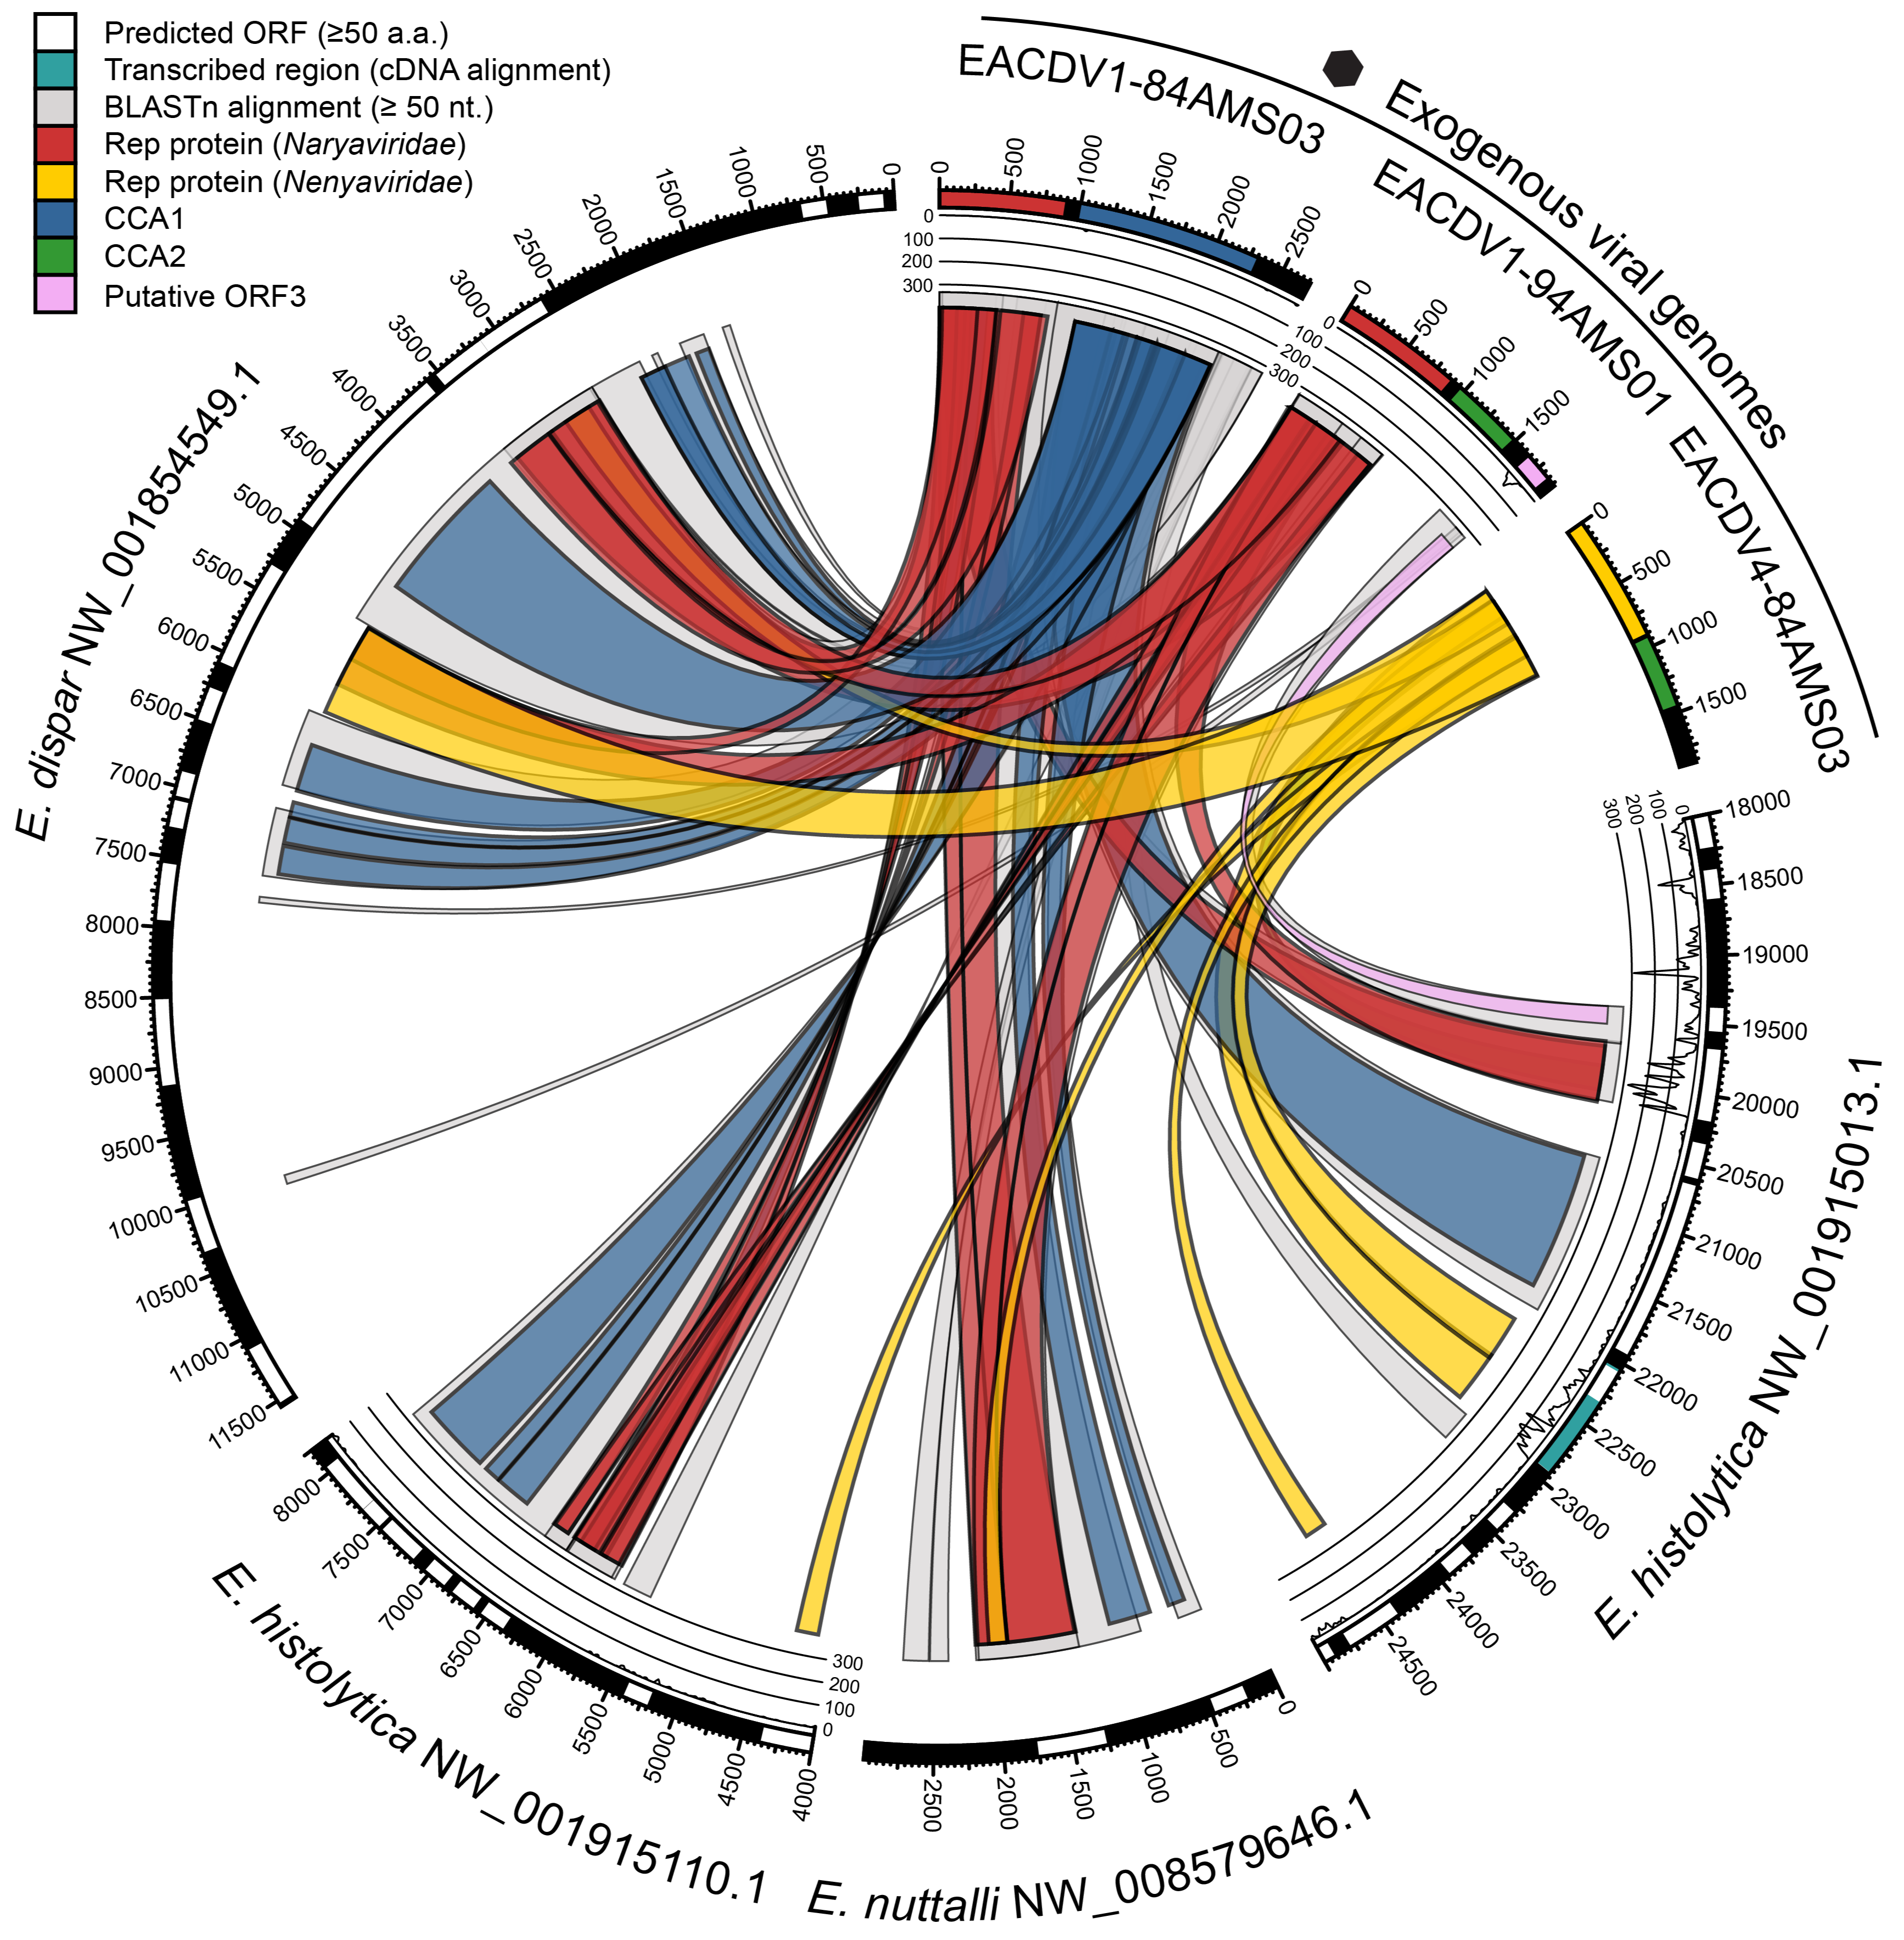
Visualising complex genomic features and multiple alignments. Here, showing sequence identity between virus genes and endogenous viral element regions in parasite genomes. Also shown is read coverage of some endogenous viruses by AGO2-2-associated small RNAs, part of the RNAi silencing system, a possible example of protist antiviral defence.
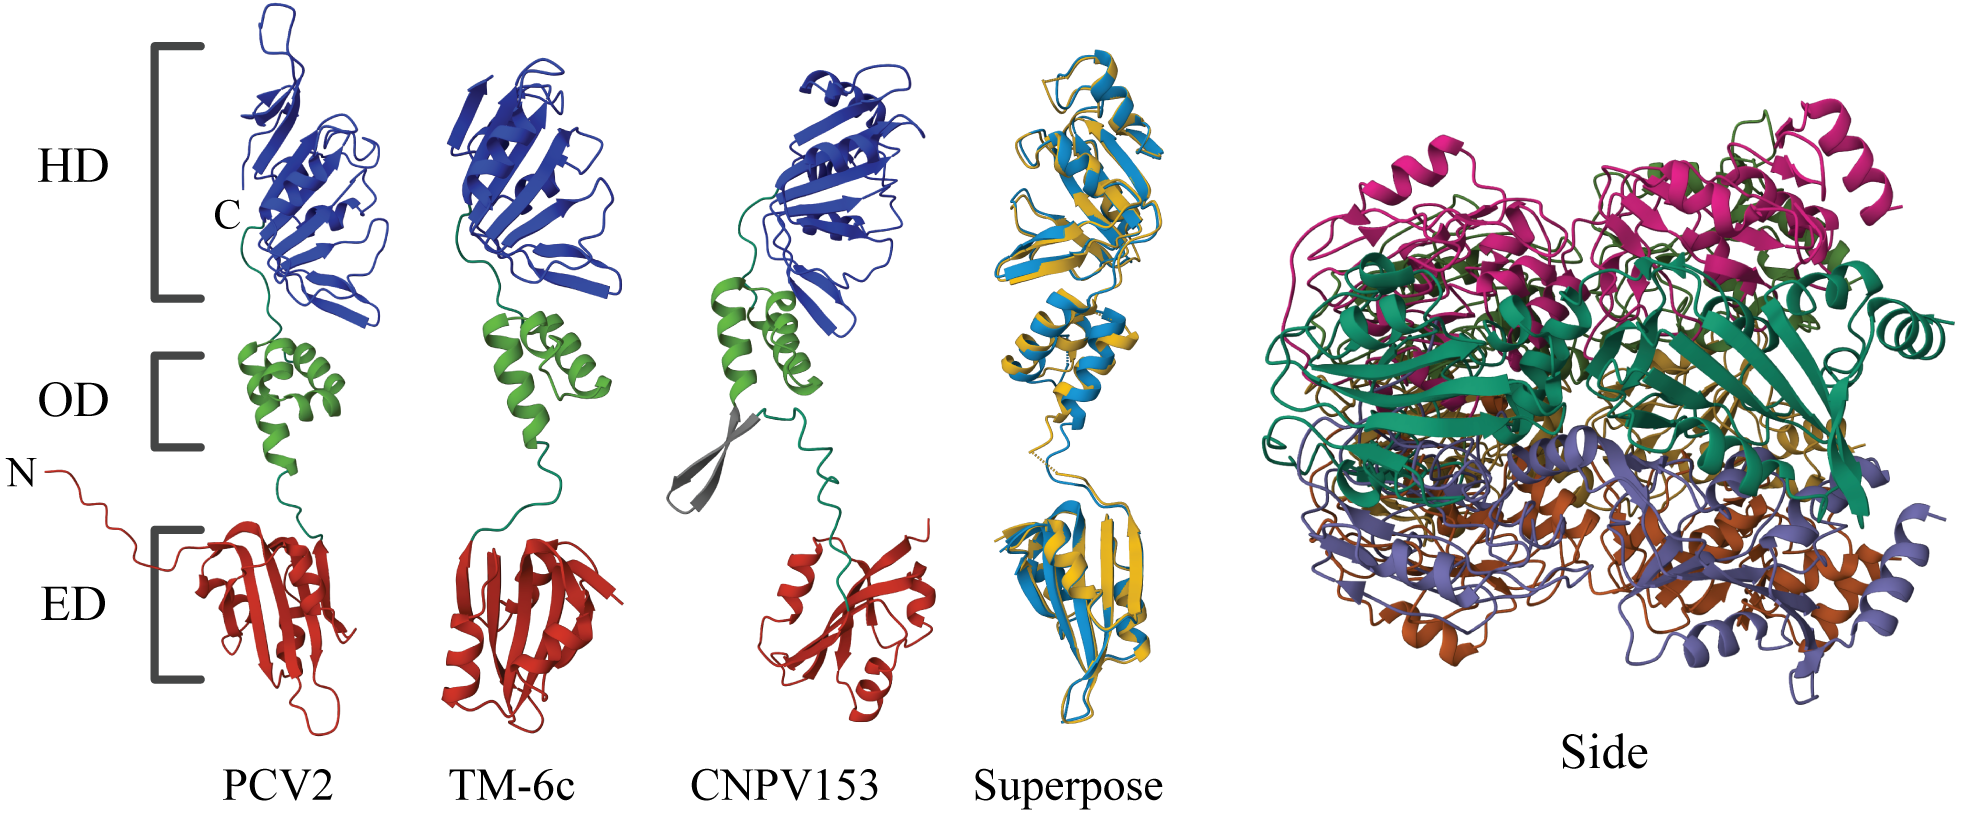
Alphafold in combination with Mol* for protein structure and domain analysis. Here, both predicted monomer and multimer structures of proteins involved with single-stranded DNA replication were explored.
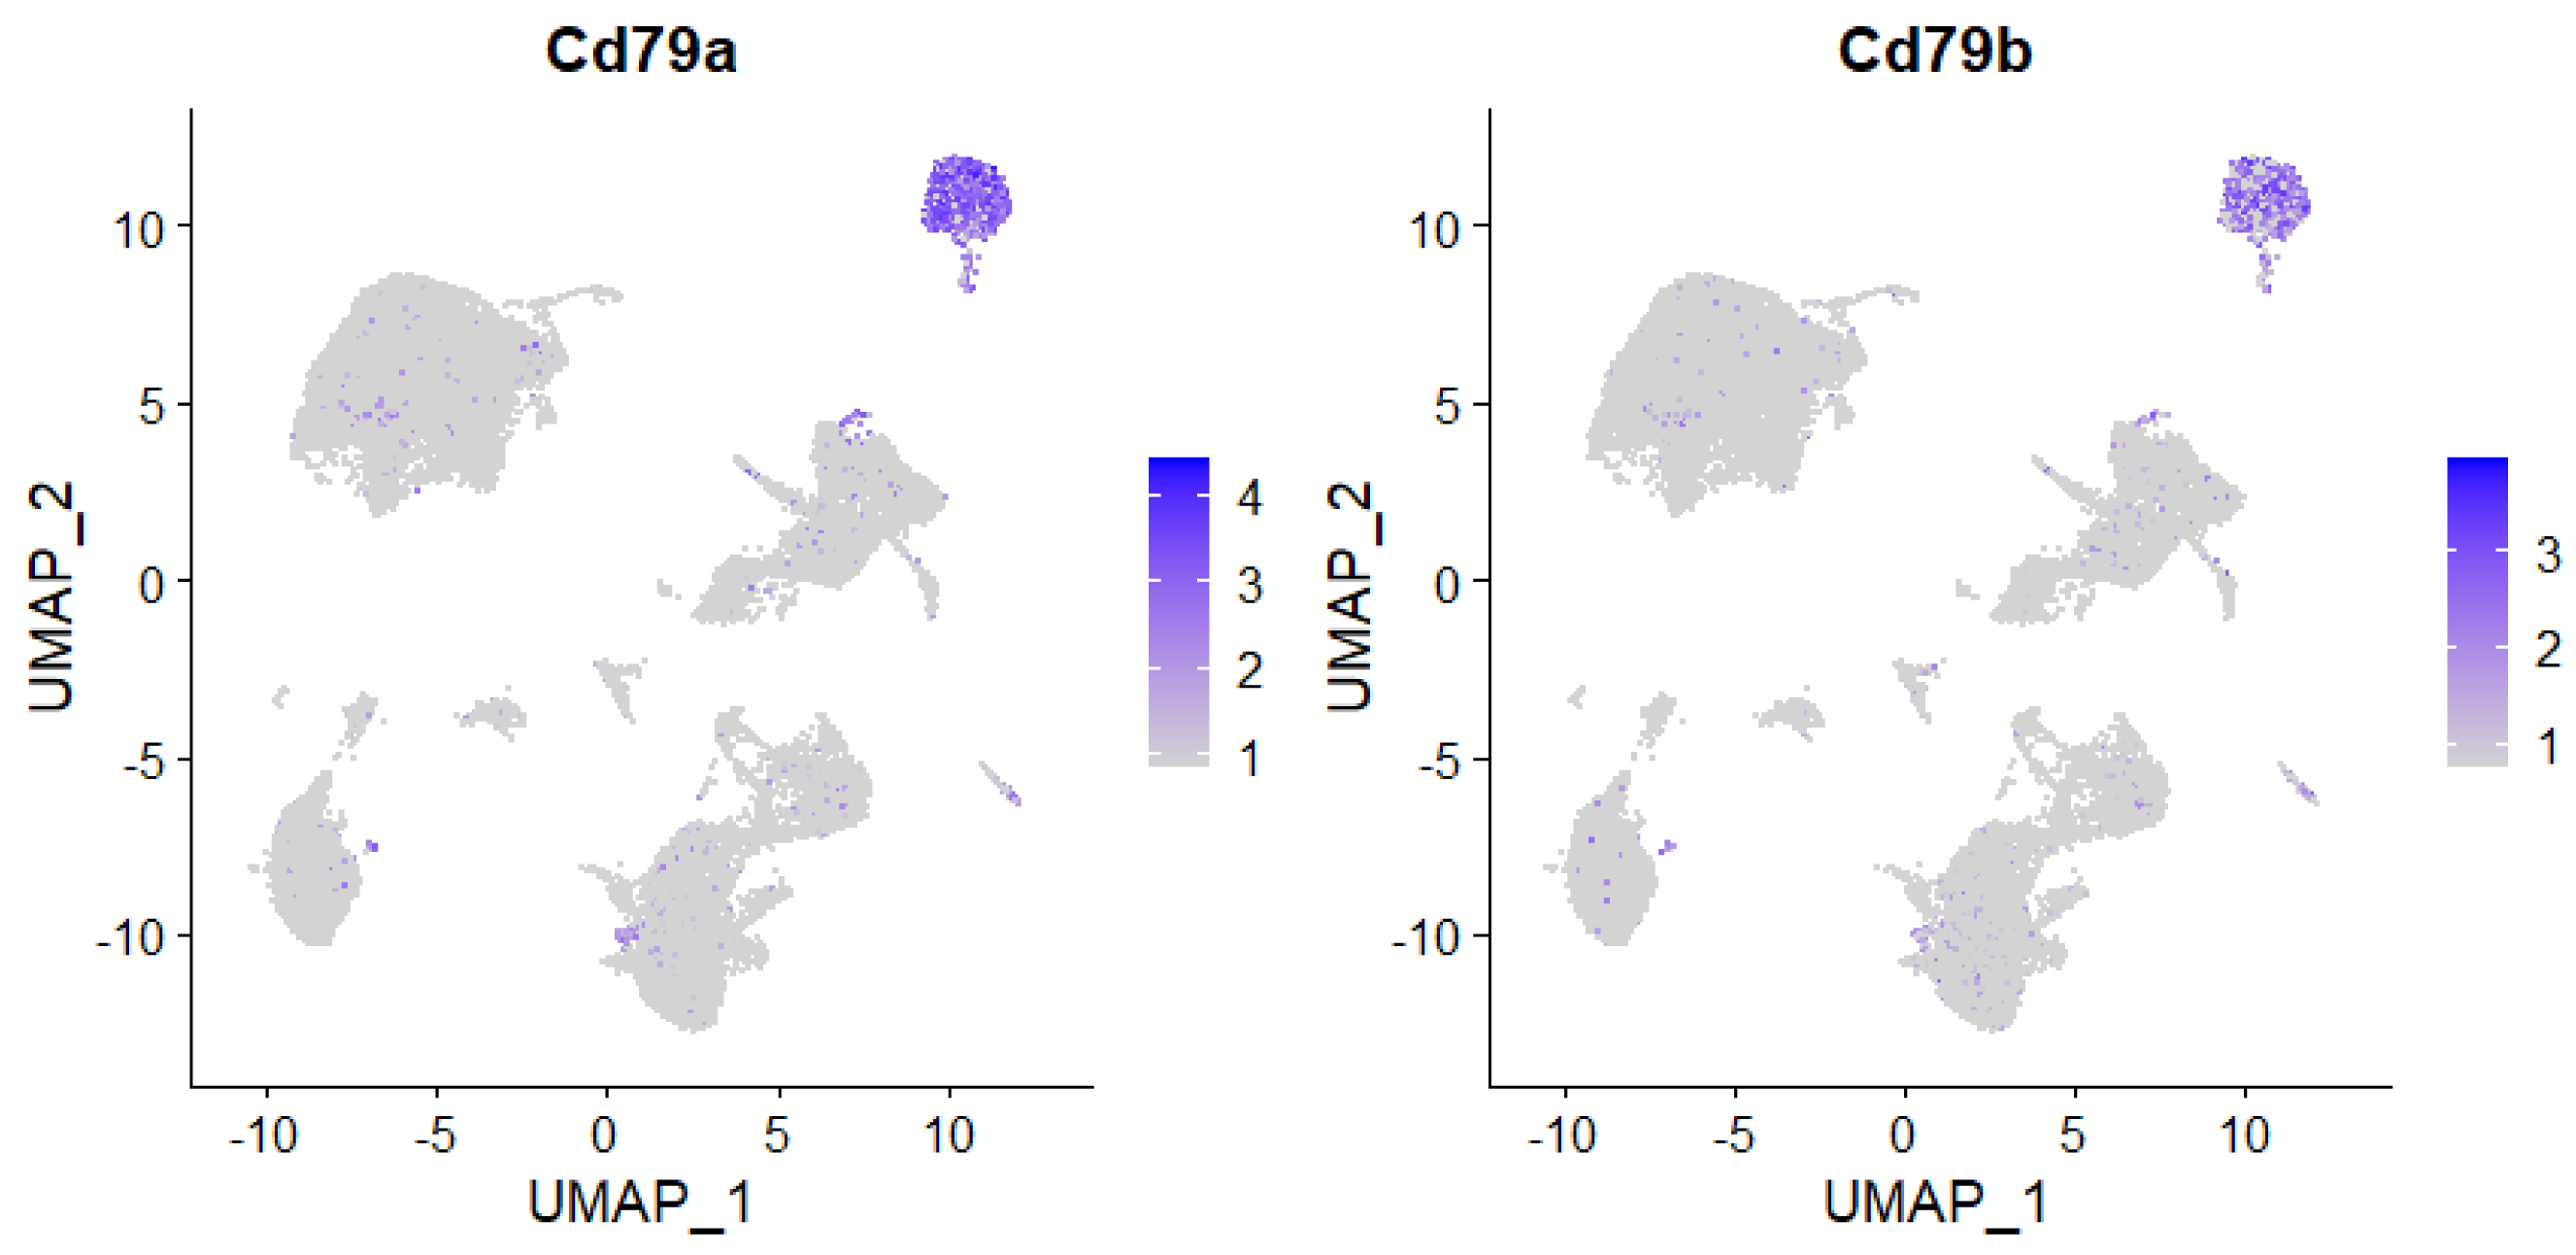
Single-cell RNA-Seq enables examination of cell type specific changes throughout disease states. Here, Seurat was used to cluster cells by their respective expression profiles. Expression of B cell markers was then used to identify and label that population of immune cells.
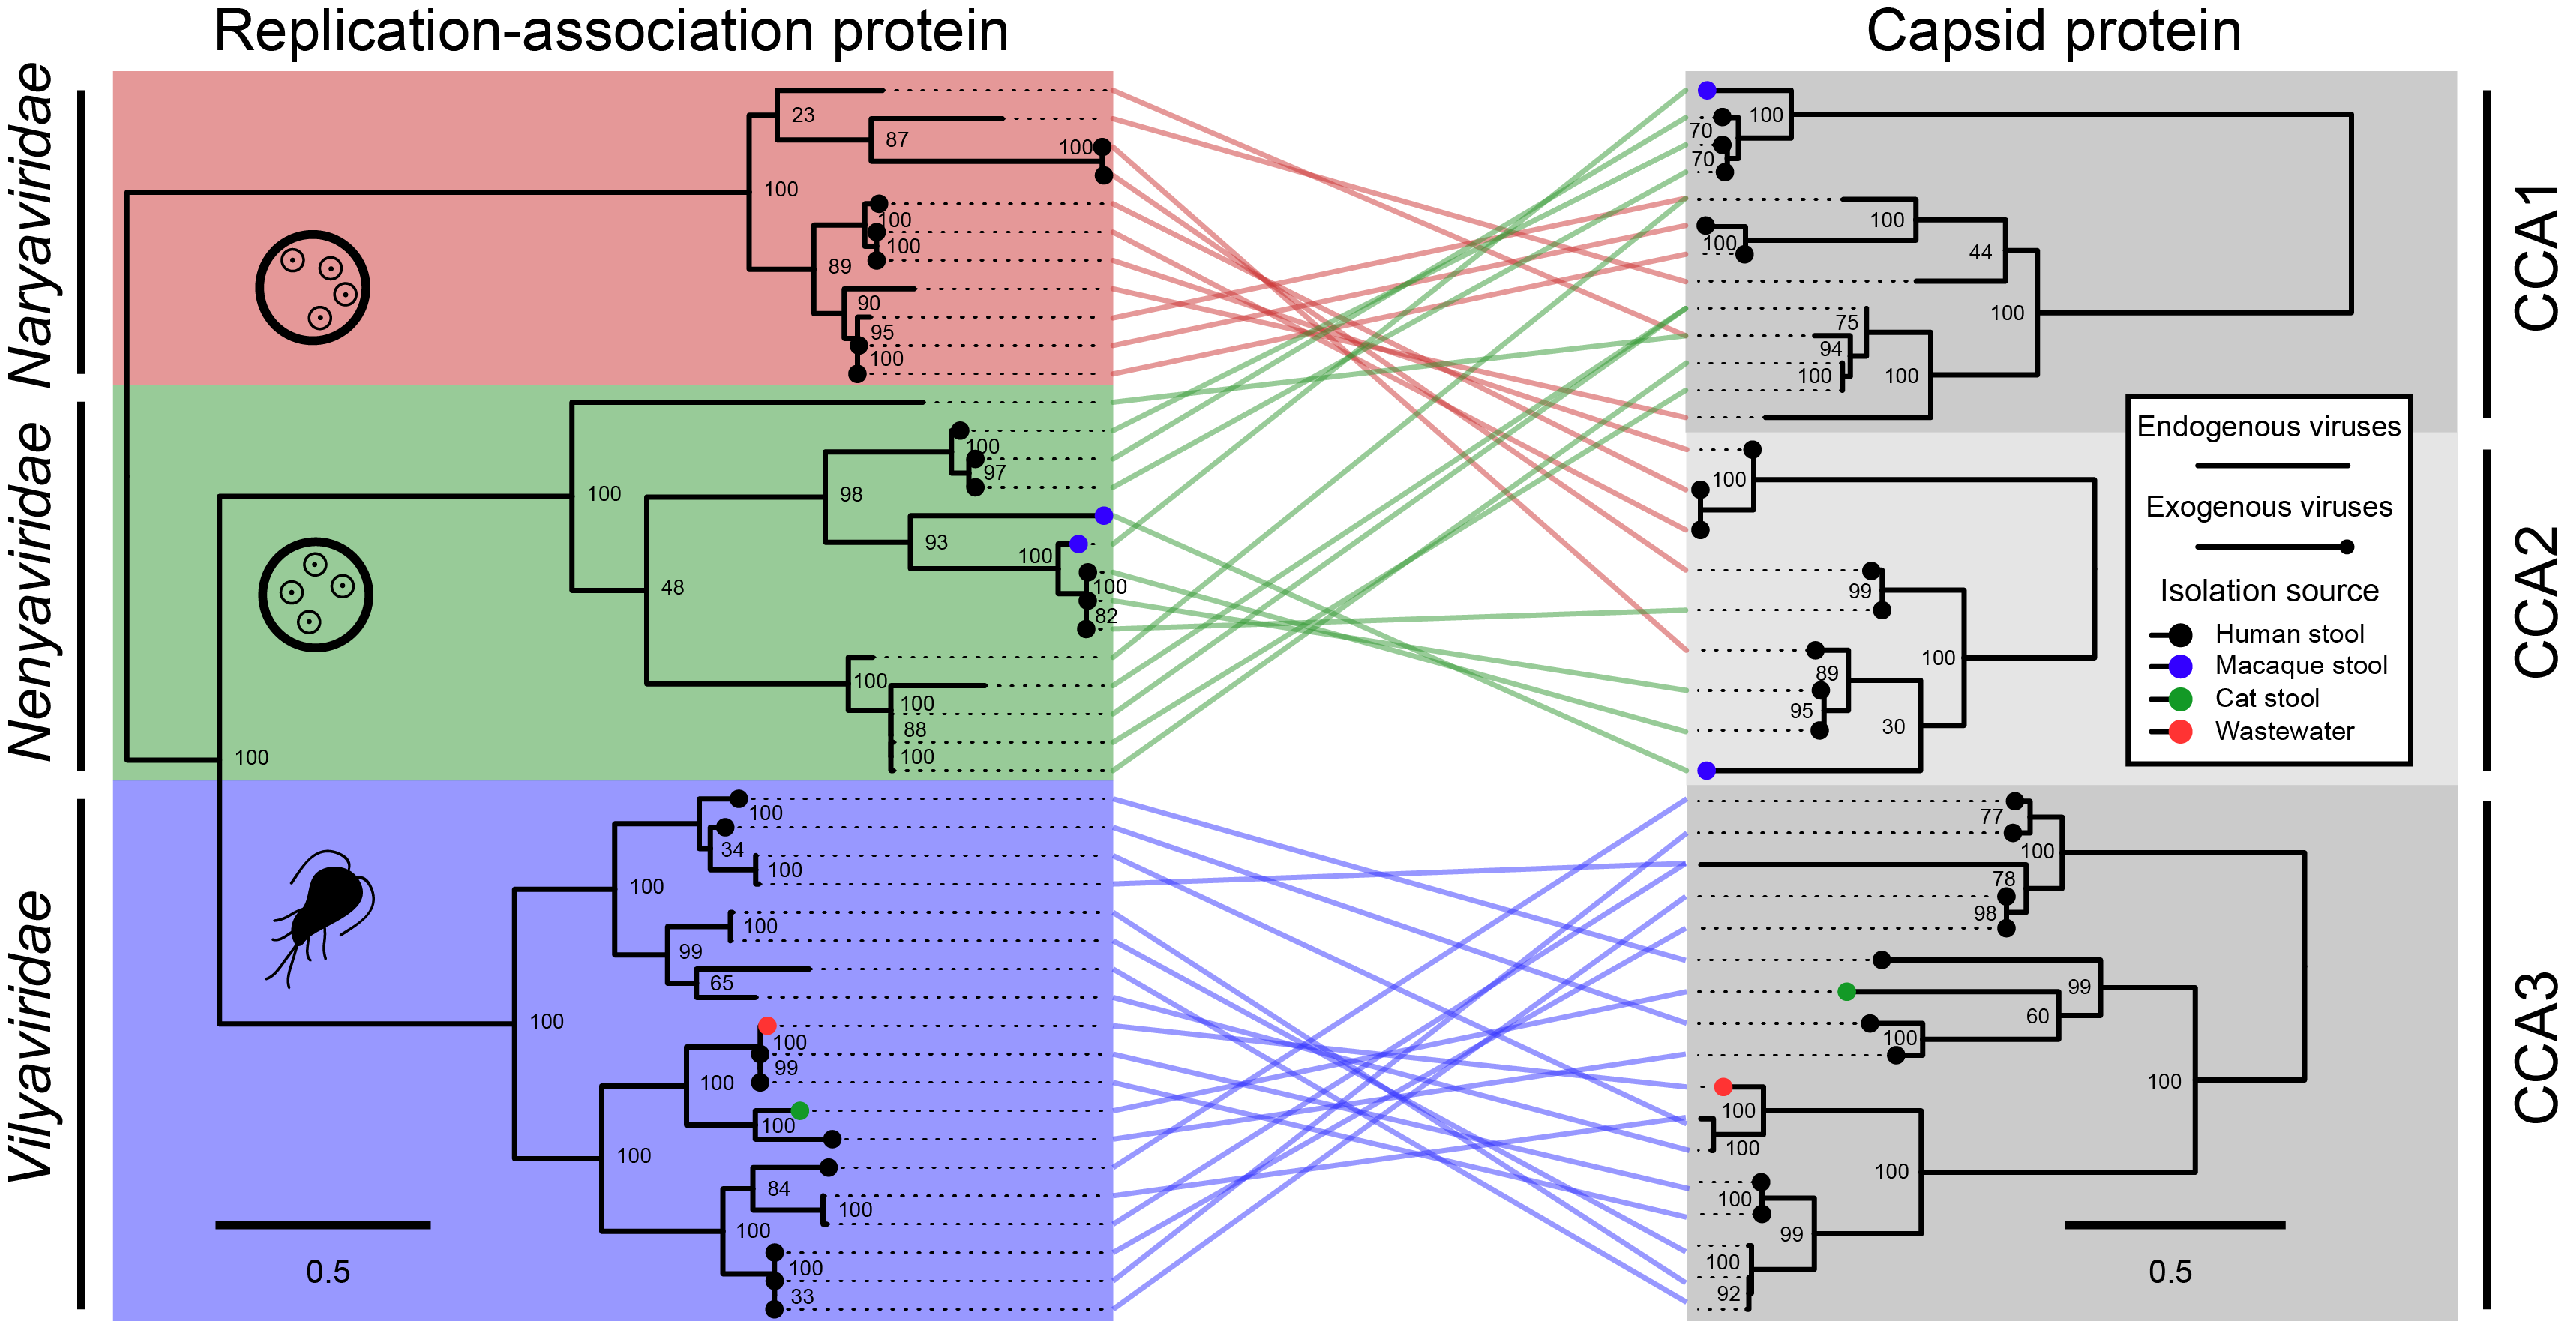
A tanglegram can reveal patterns of either concordant or discordant evolutionary history between two subjects (genes, species, etc.). Here, connections link genes found on the same virus genome. The overall pattern reveals extensive and reciprocal recombination of genetic modules between two virus families (Naryaviridae & Nenyaviridae). Given these families had unknown hosts, we argued their ability to recombine supported a shared host, which we showed was Entamoeba.
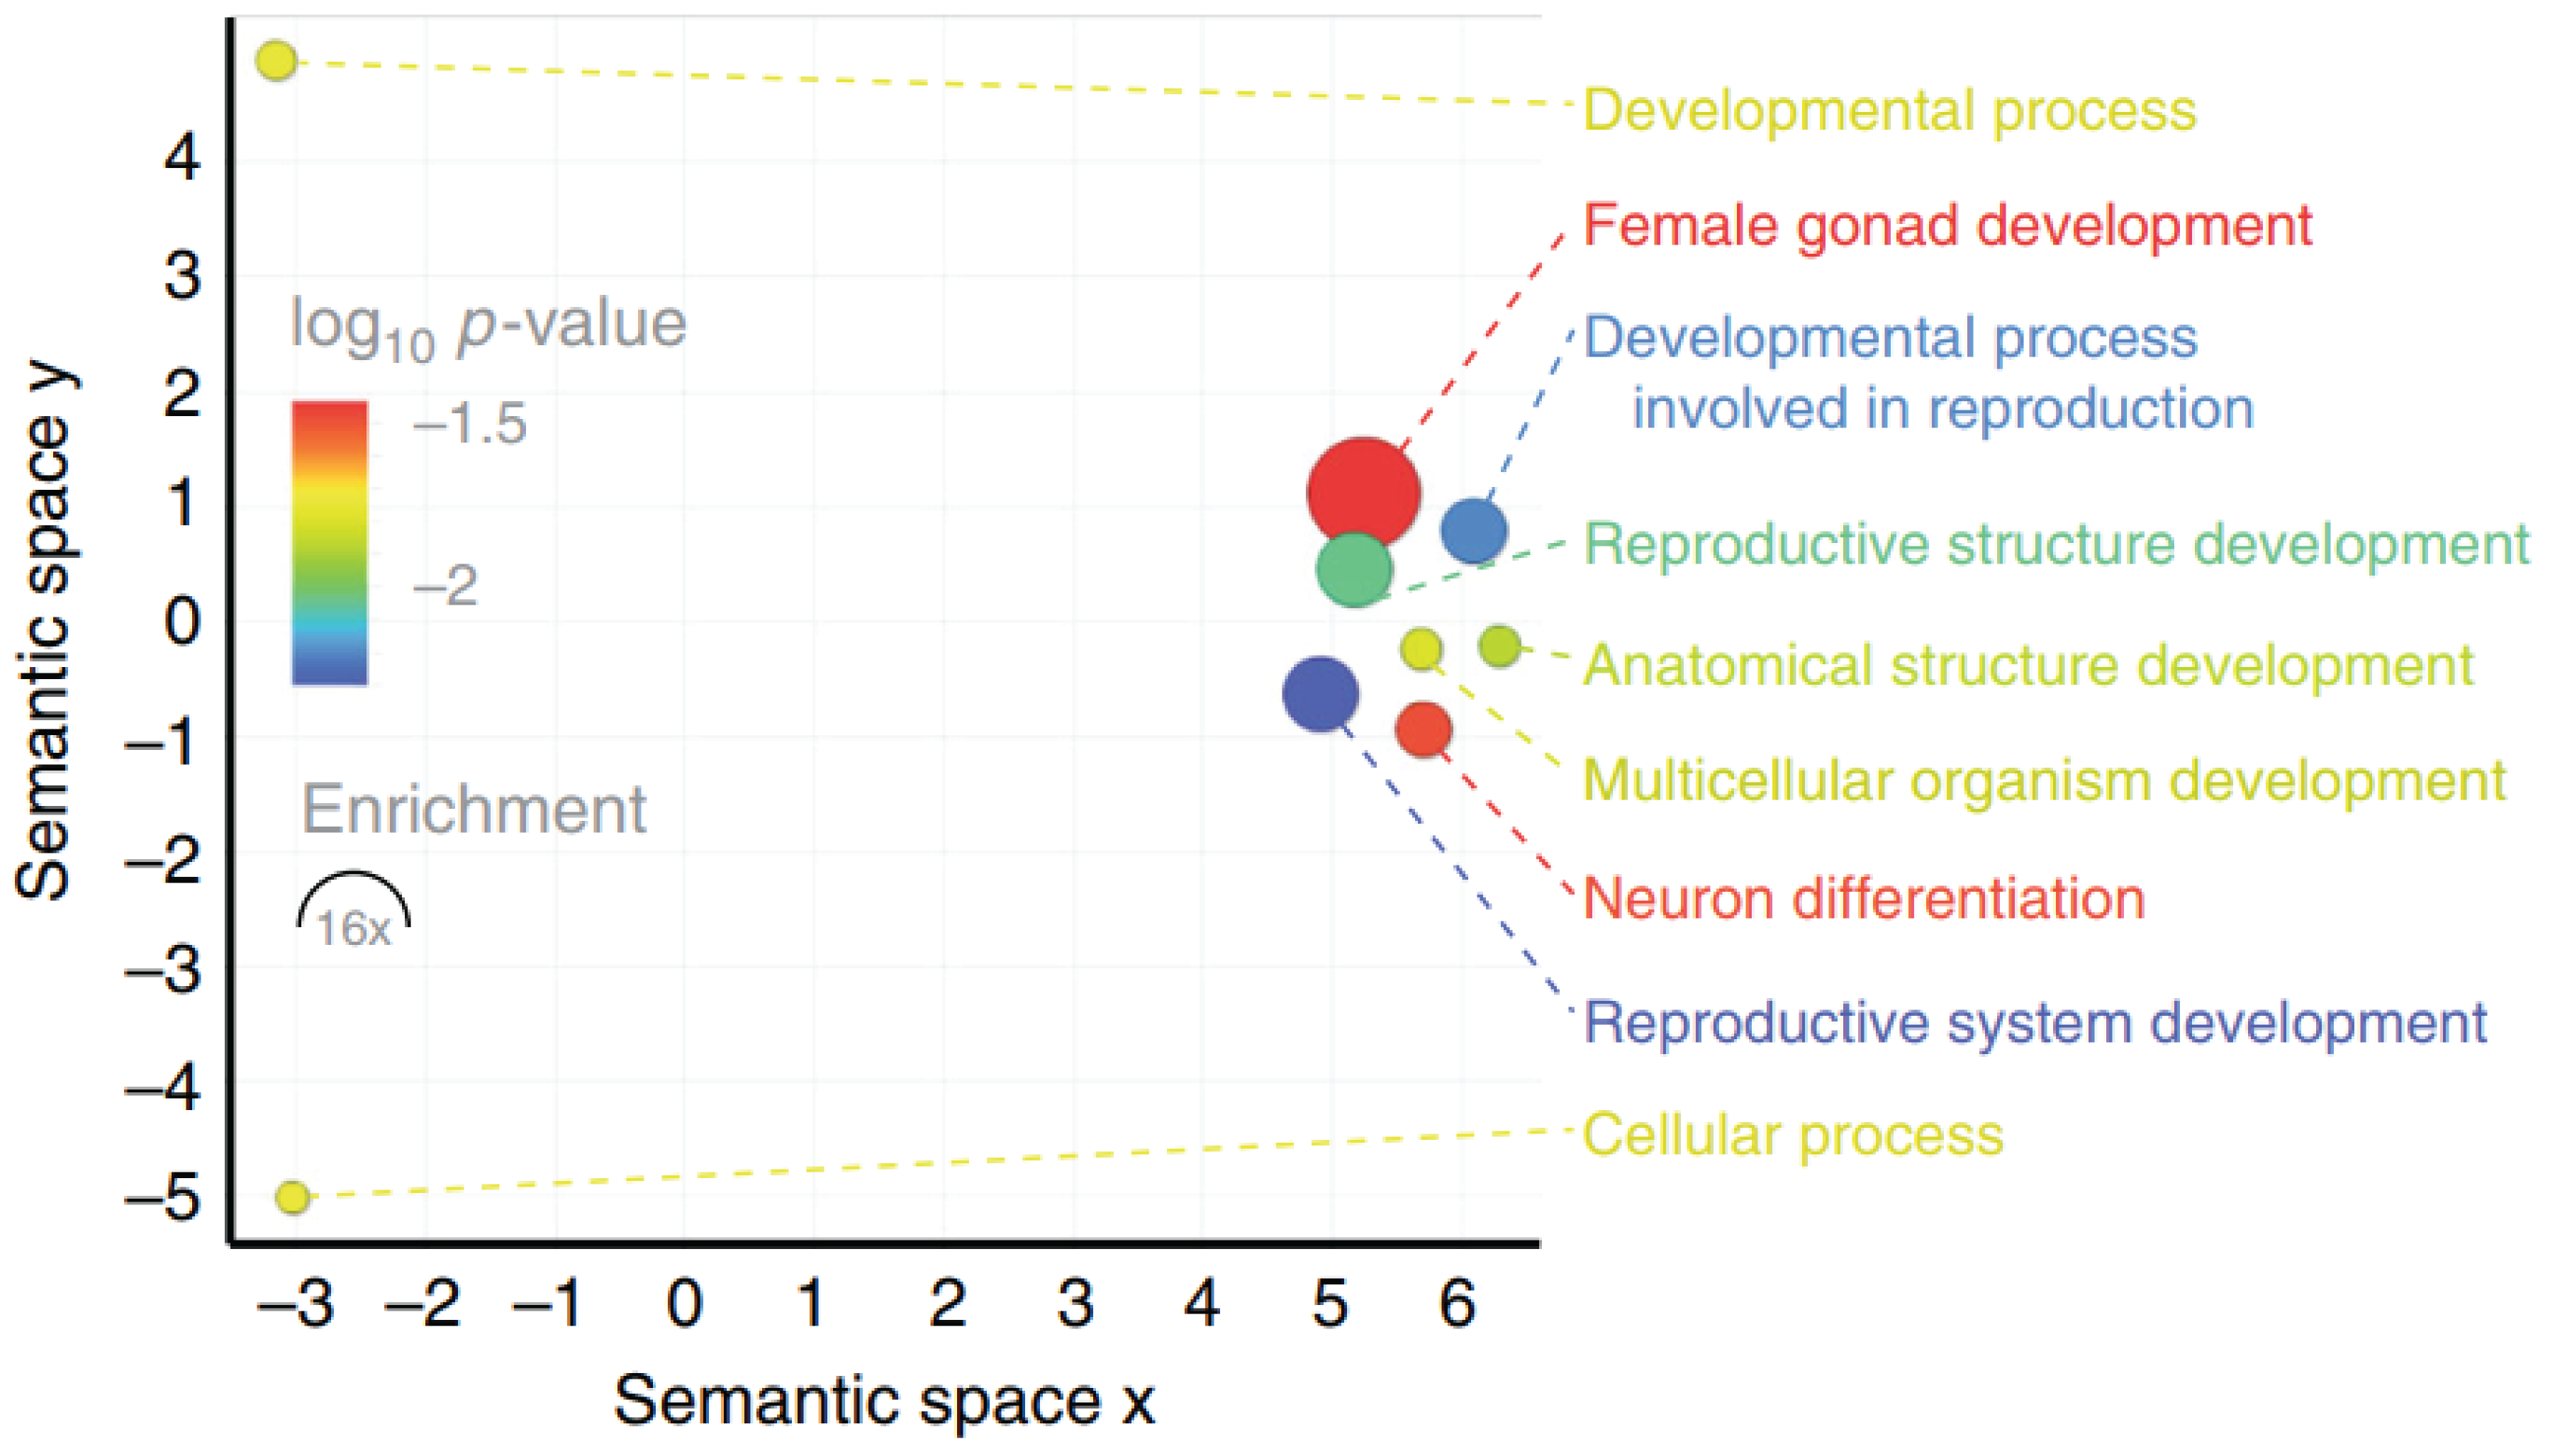
Genes identified on the songbird germline-restricted chromosome (GRC) were subjected to GO term enrichment analysis, motivated by the unknown role of the GRC and its unusual genetic features.

Genome synteny plot, here examining whole avipoxvirus genomes to better understand some horizontally transferred genes from ssDNA viruses (marked in red). Despite substantial genome size disparity, overall gene order is highly conserved across the genus Avipoxvirus.
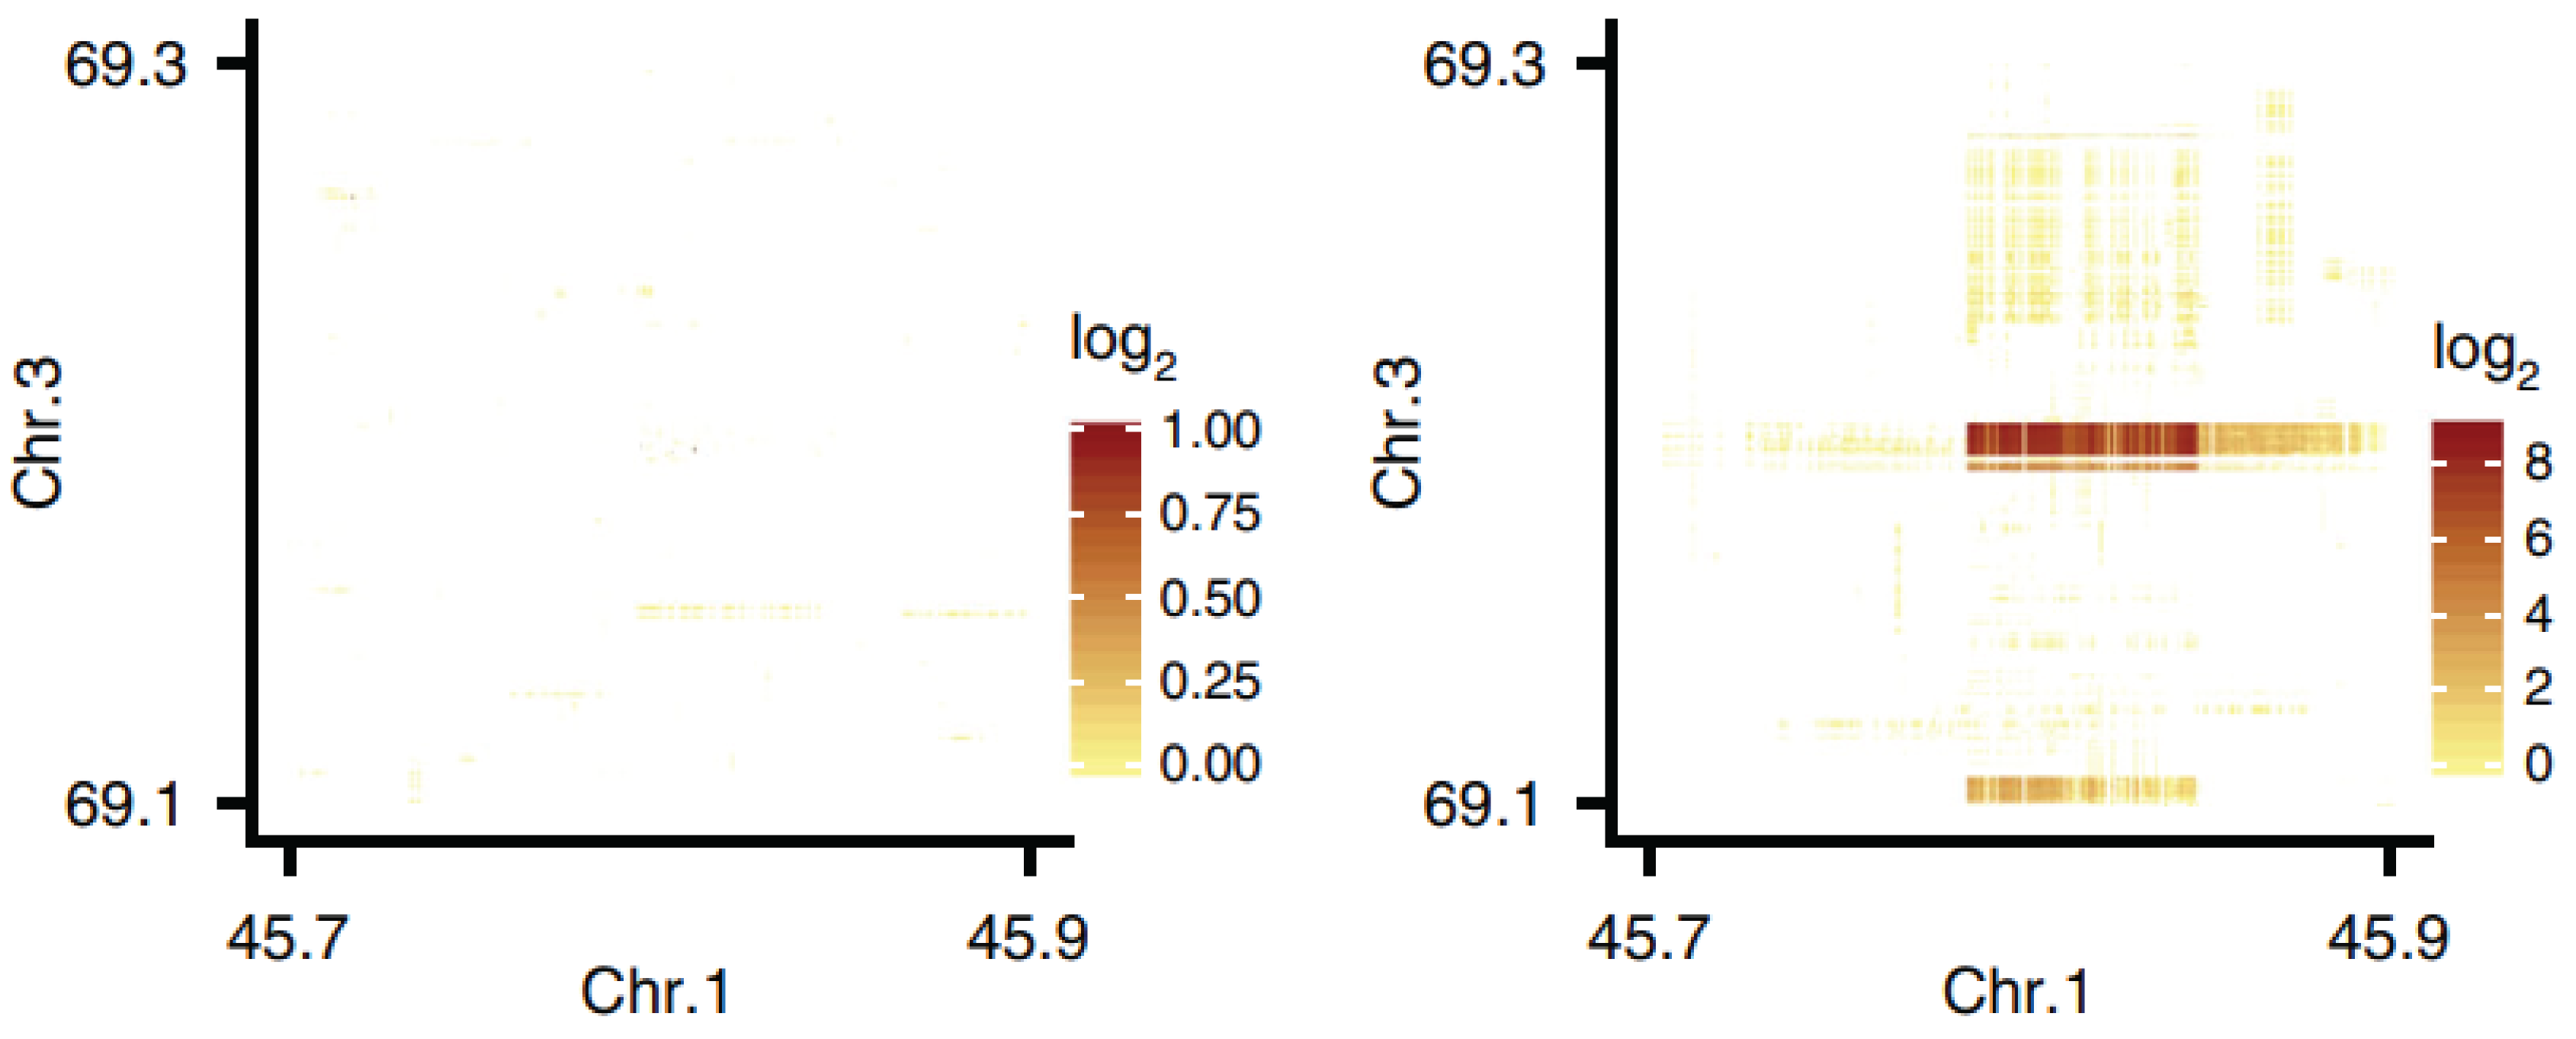
10X Genomics linked-reads derive from a (now discontinued) pseudo long-read library preparation method. Barcode enrichment signified reads derived from physically close DNA regions. Here, the same genomic region is examined in two samples. In the left panel we see a library prepared from zebra finch liver (somatic cells), and on the right a library prepared from testis (including germline cells). Reads that map to chromosomes 1 and 3 are physically close in the testis but not the liver, supporting the existence of a tissue-specific structural variant (with respect to the somatic reference assembly). In fact this pattern comes from a “hybrid chromosome” known as the germline-restricted chromosome, which itself includes regions derived from all autosomes.
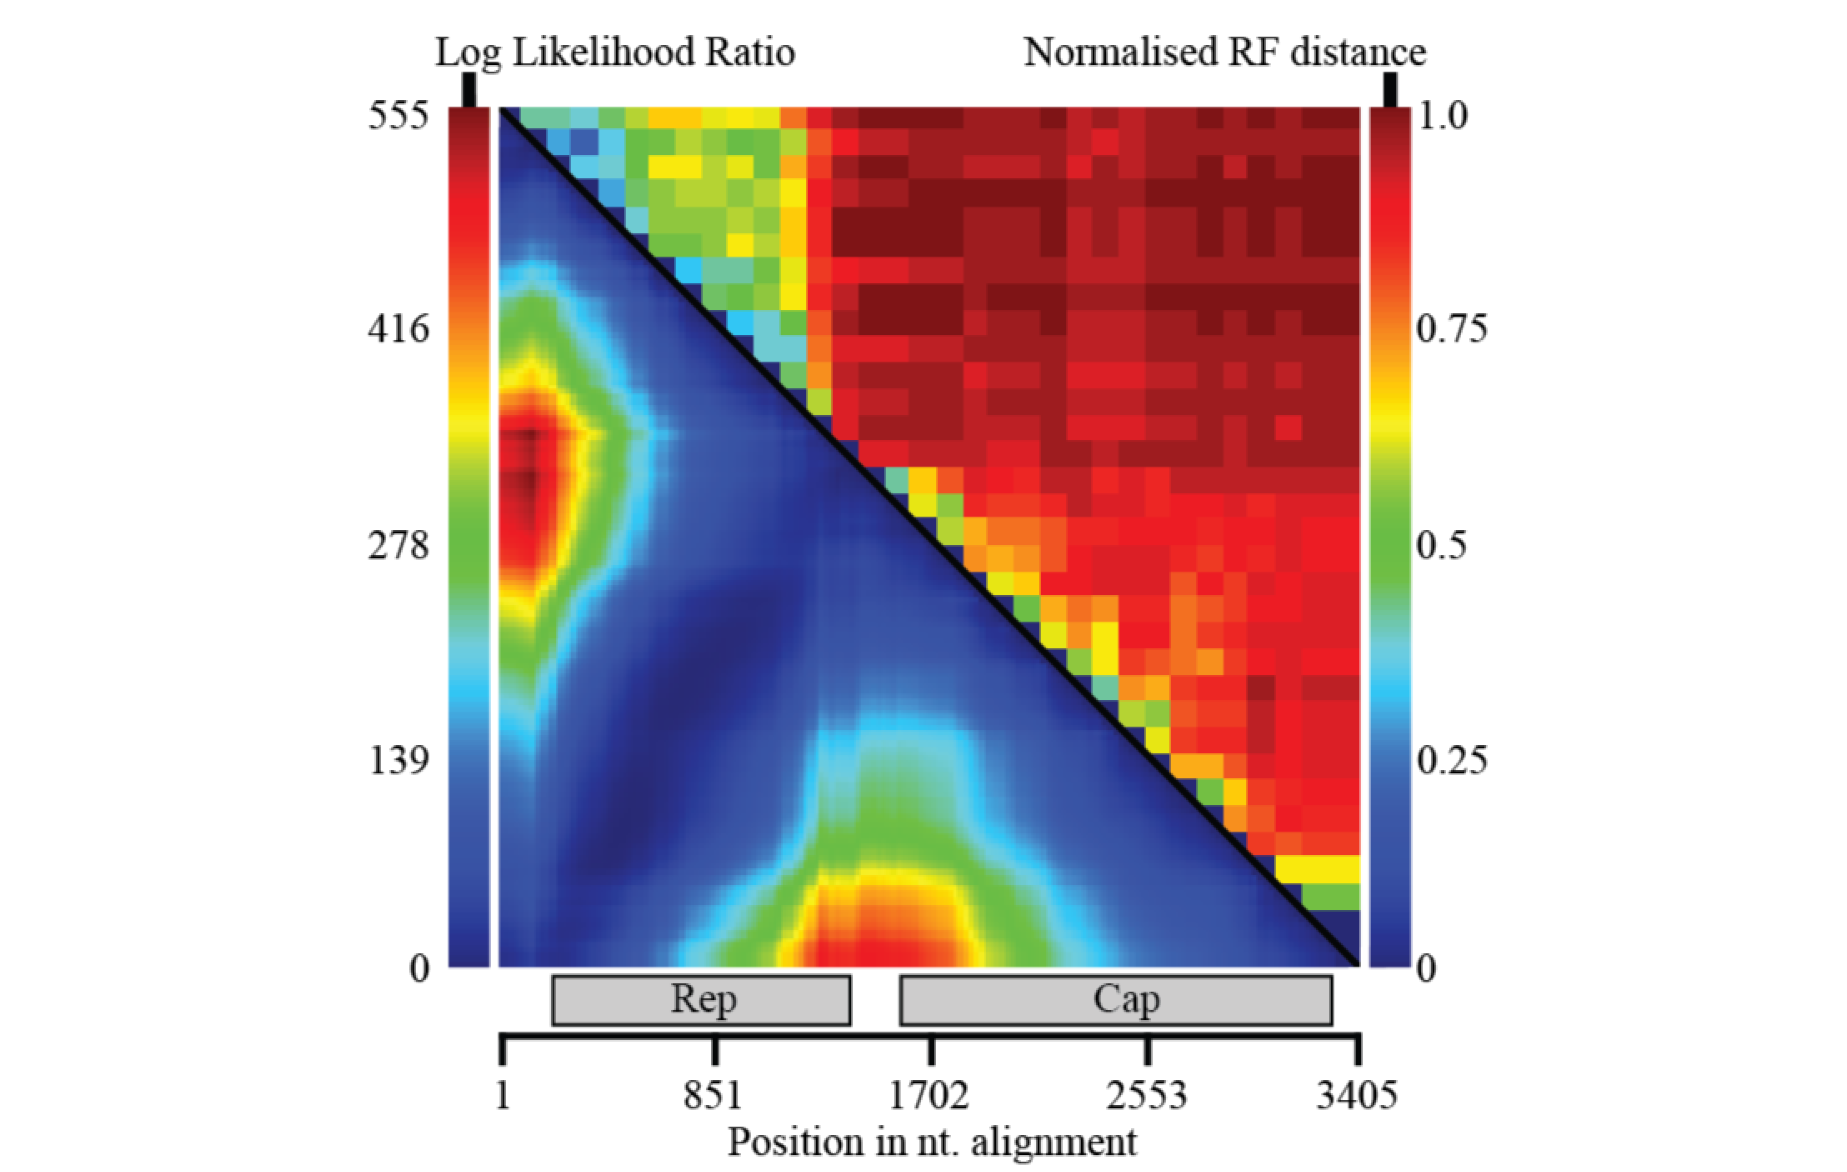
Knowledge of recombination patterns may be useful for several questions. Here, RDP4 was used to understand where recombination is most commonly observed in redondovirus genomes. In the lower left is a matrix of recombination breakpoint pairs, essentially revealing that blocks of recombination span from the start to the end of genes (more rarely occurring within genes). On the top right, windows of phylogenetic compatibility across the genomes show the same picture. Lower phylogenetic compatibility (higher Robinson-Foulds distance) is found between genes than within them.
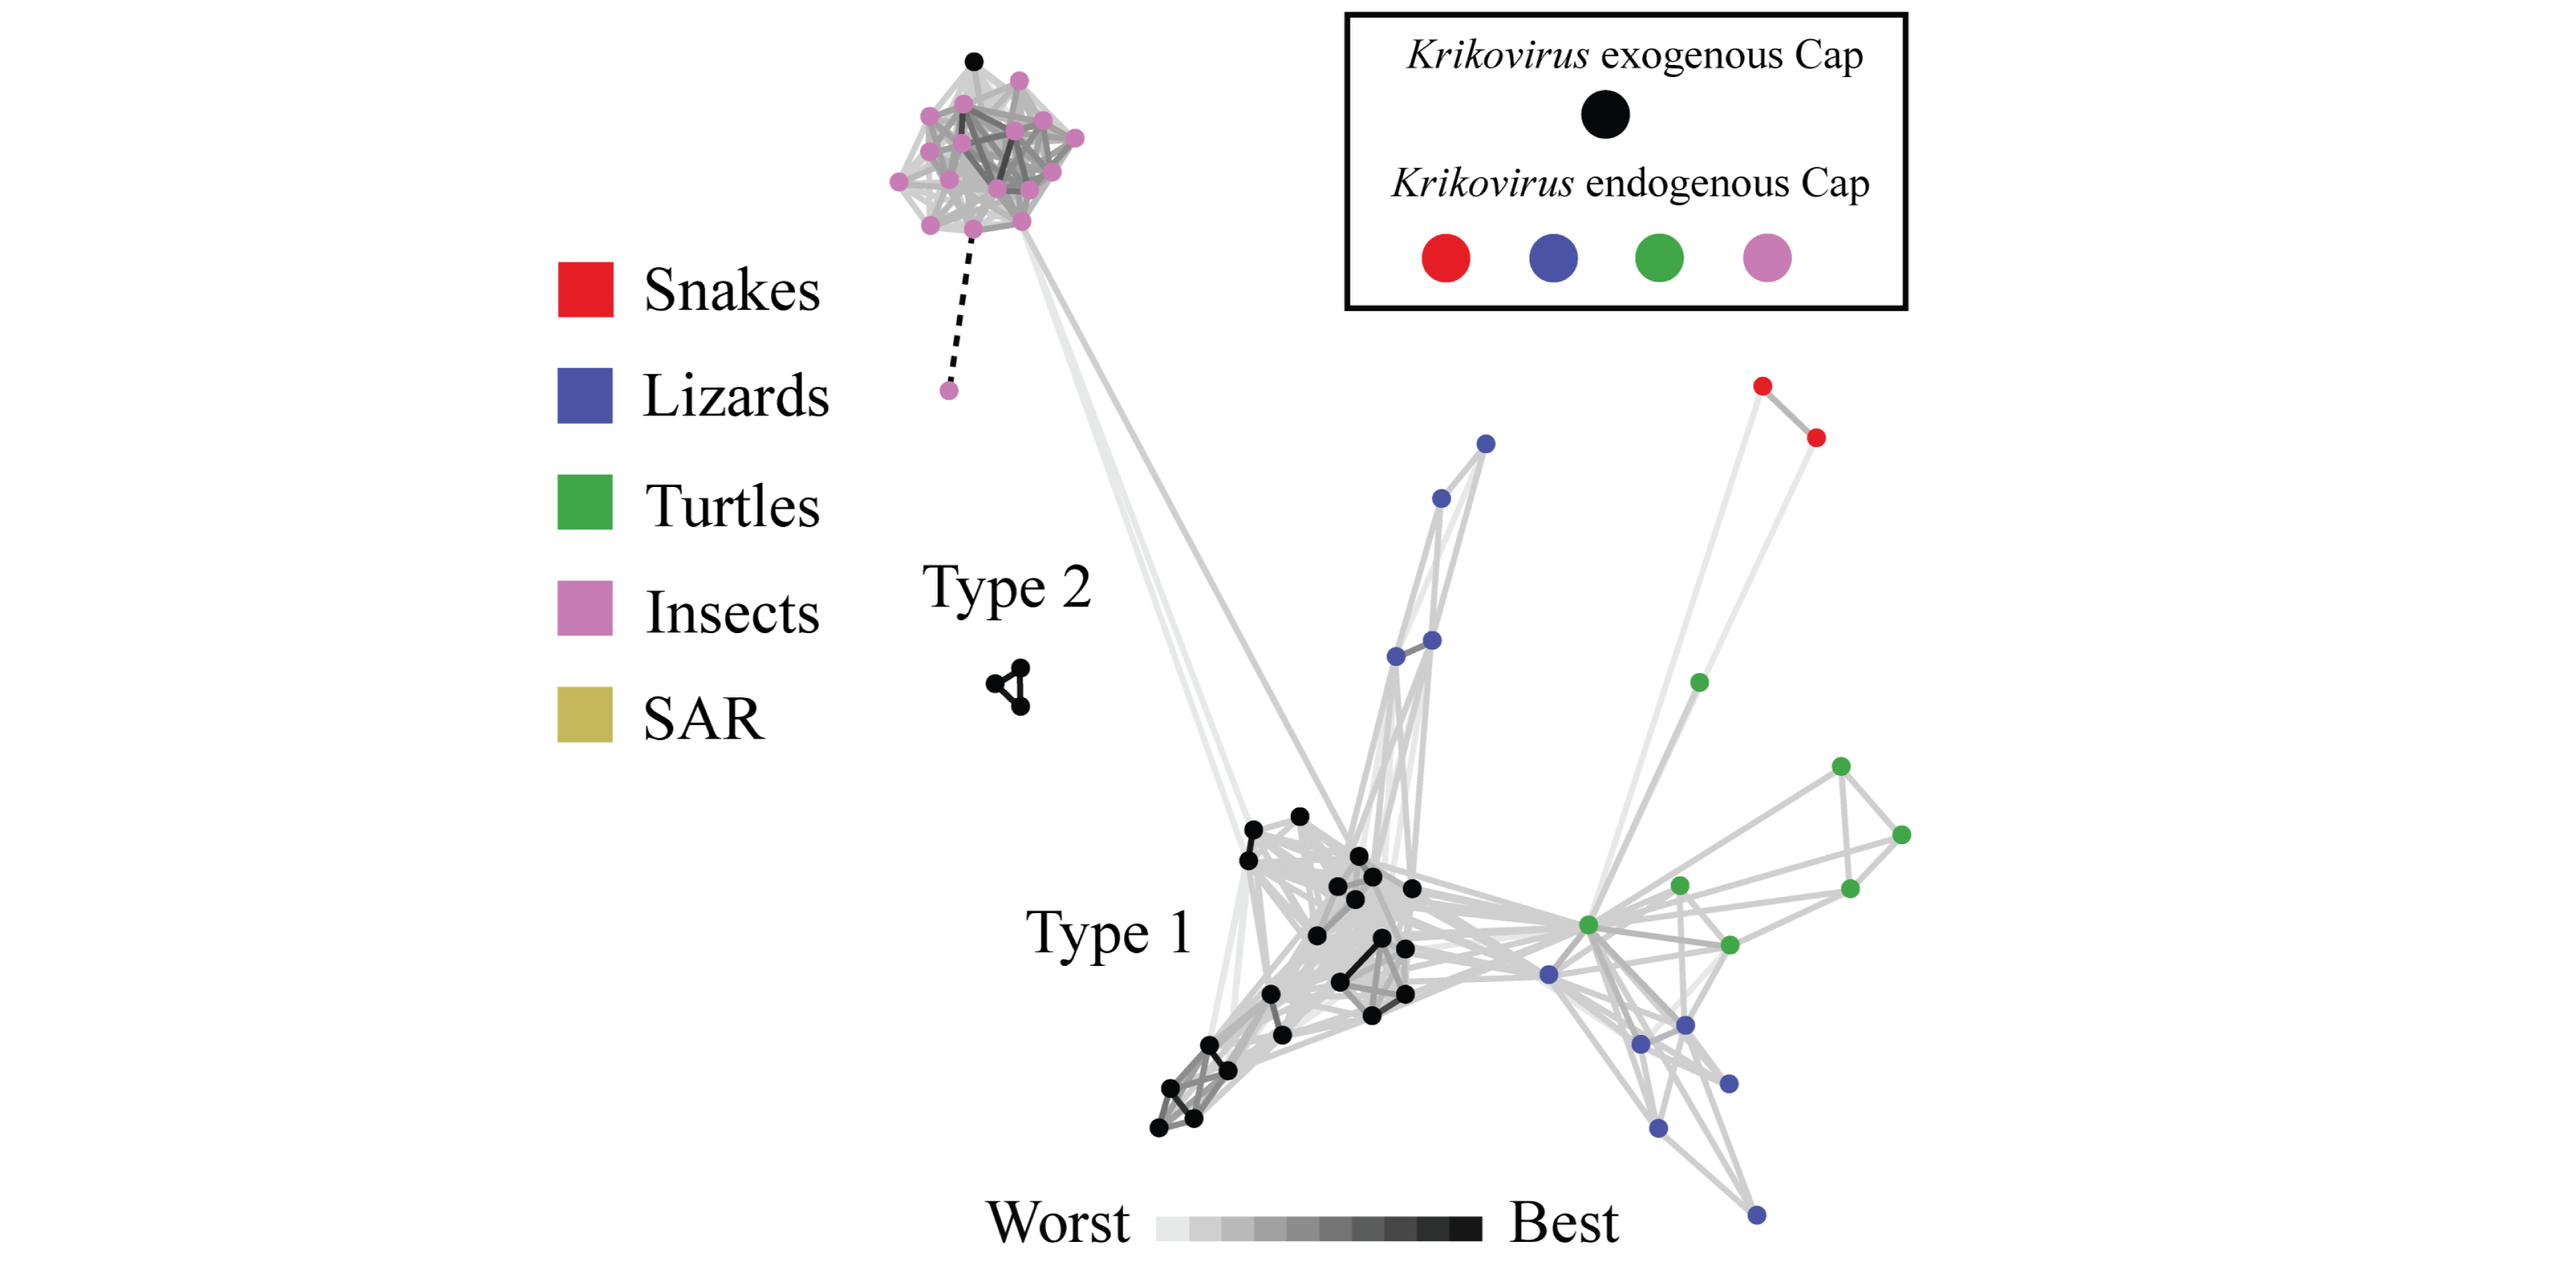
Rapid insight into protein sequence relationships can be gained using clustering tools, such as the CLANS package. Here, virus capsid proteins found in both host genomes (as endogenous elements) and exogenous viruses, were analysed together to visualise their approximate relationships.
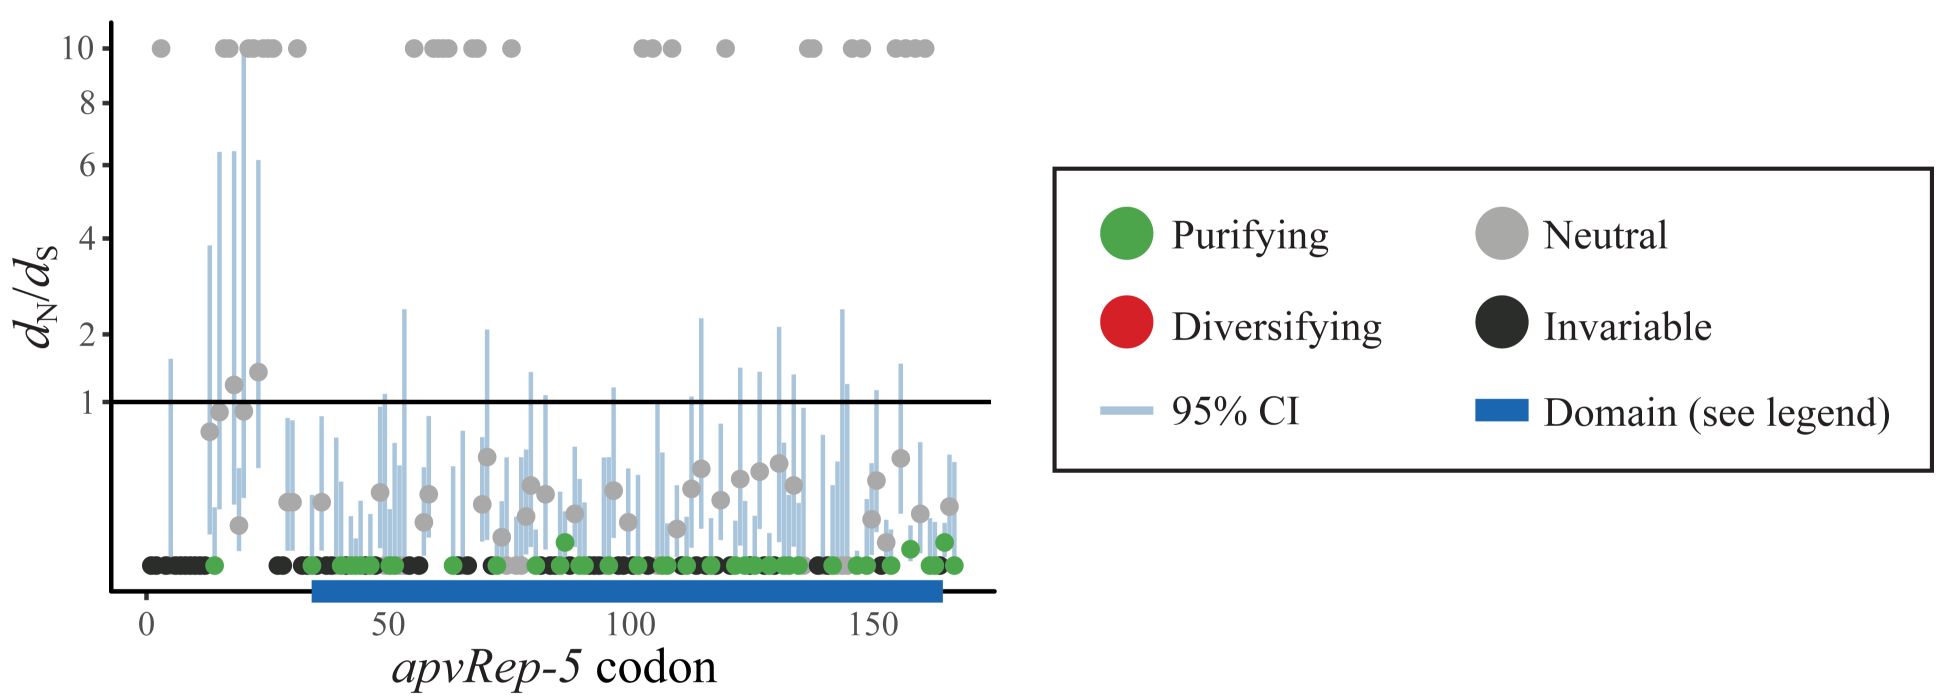
Understanding if a protein coding gene is functional or not has several steps. One line of evidence can be provided by tests for selection: is a protein sequence being maintained during evolution or not? Here, a horizontally transferred viral gene was subjected to selection analysis. It was found to be strongly conserved, especially across the protein functional domain (a helicase). We inferred this as evidence of likely functionality within the new genomic context.
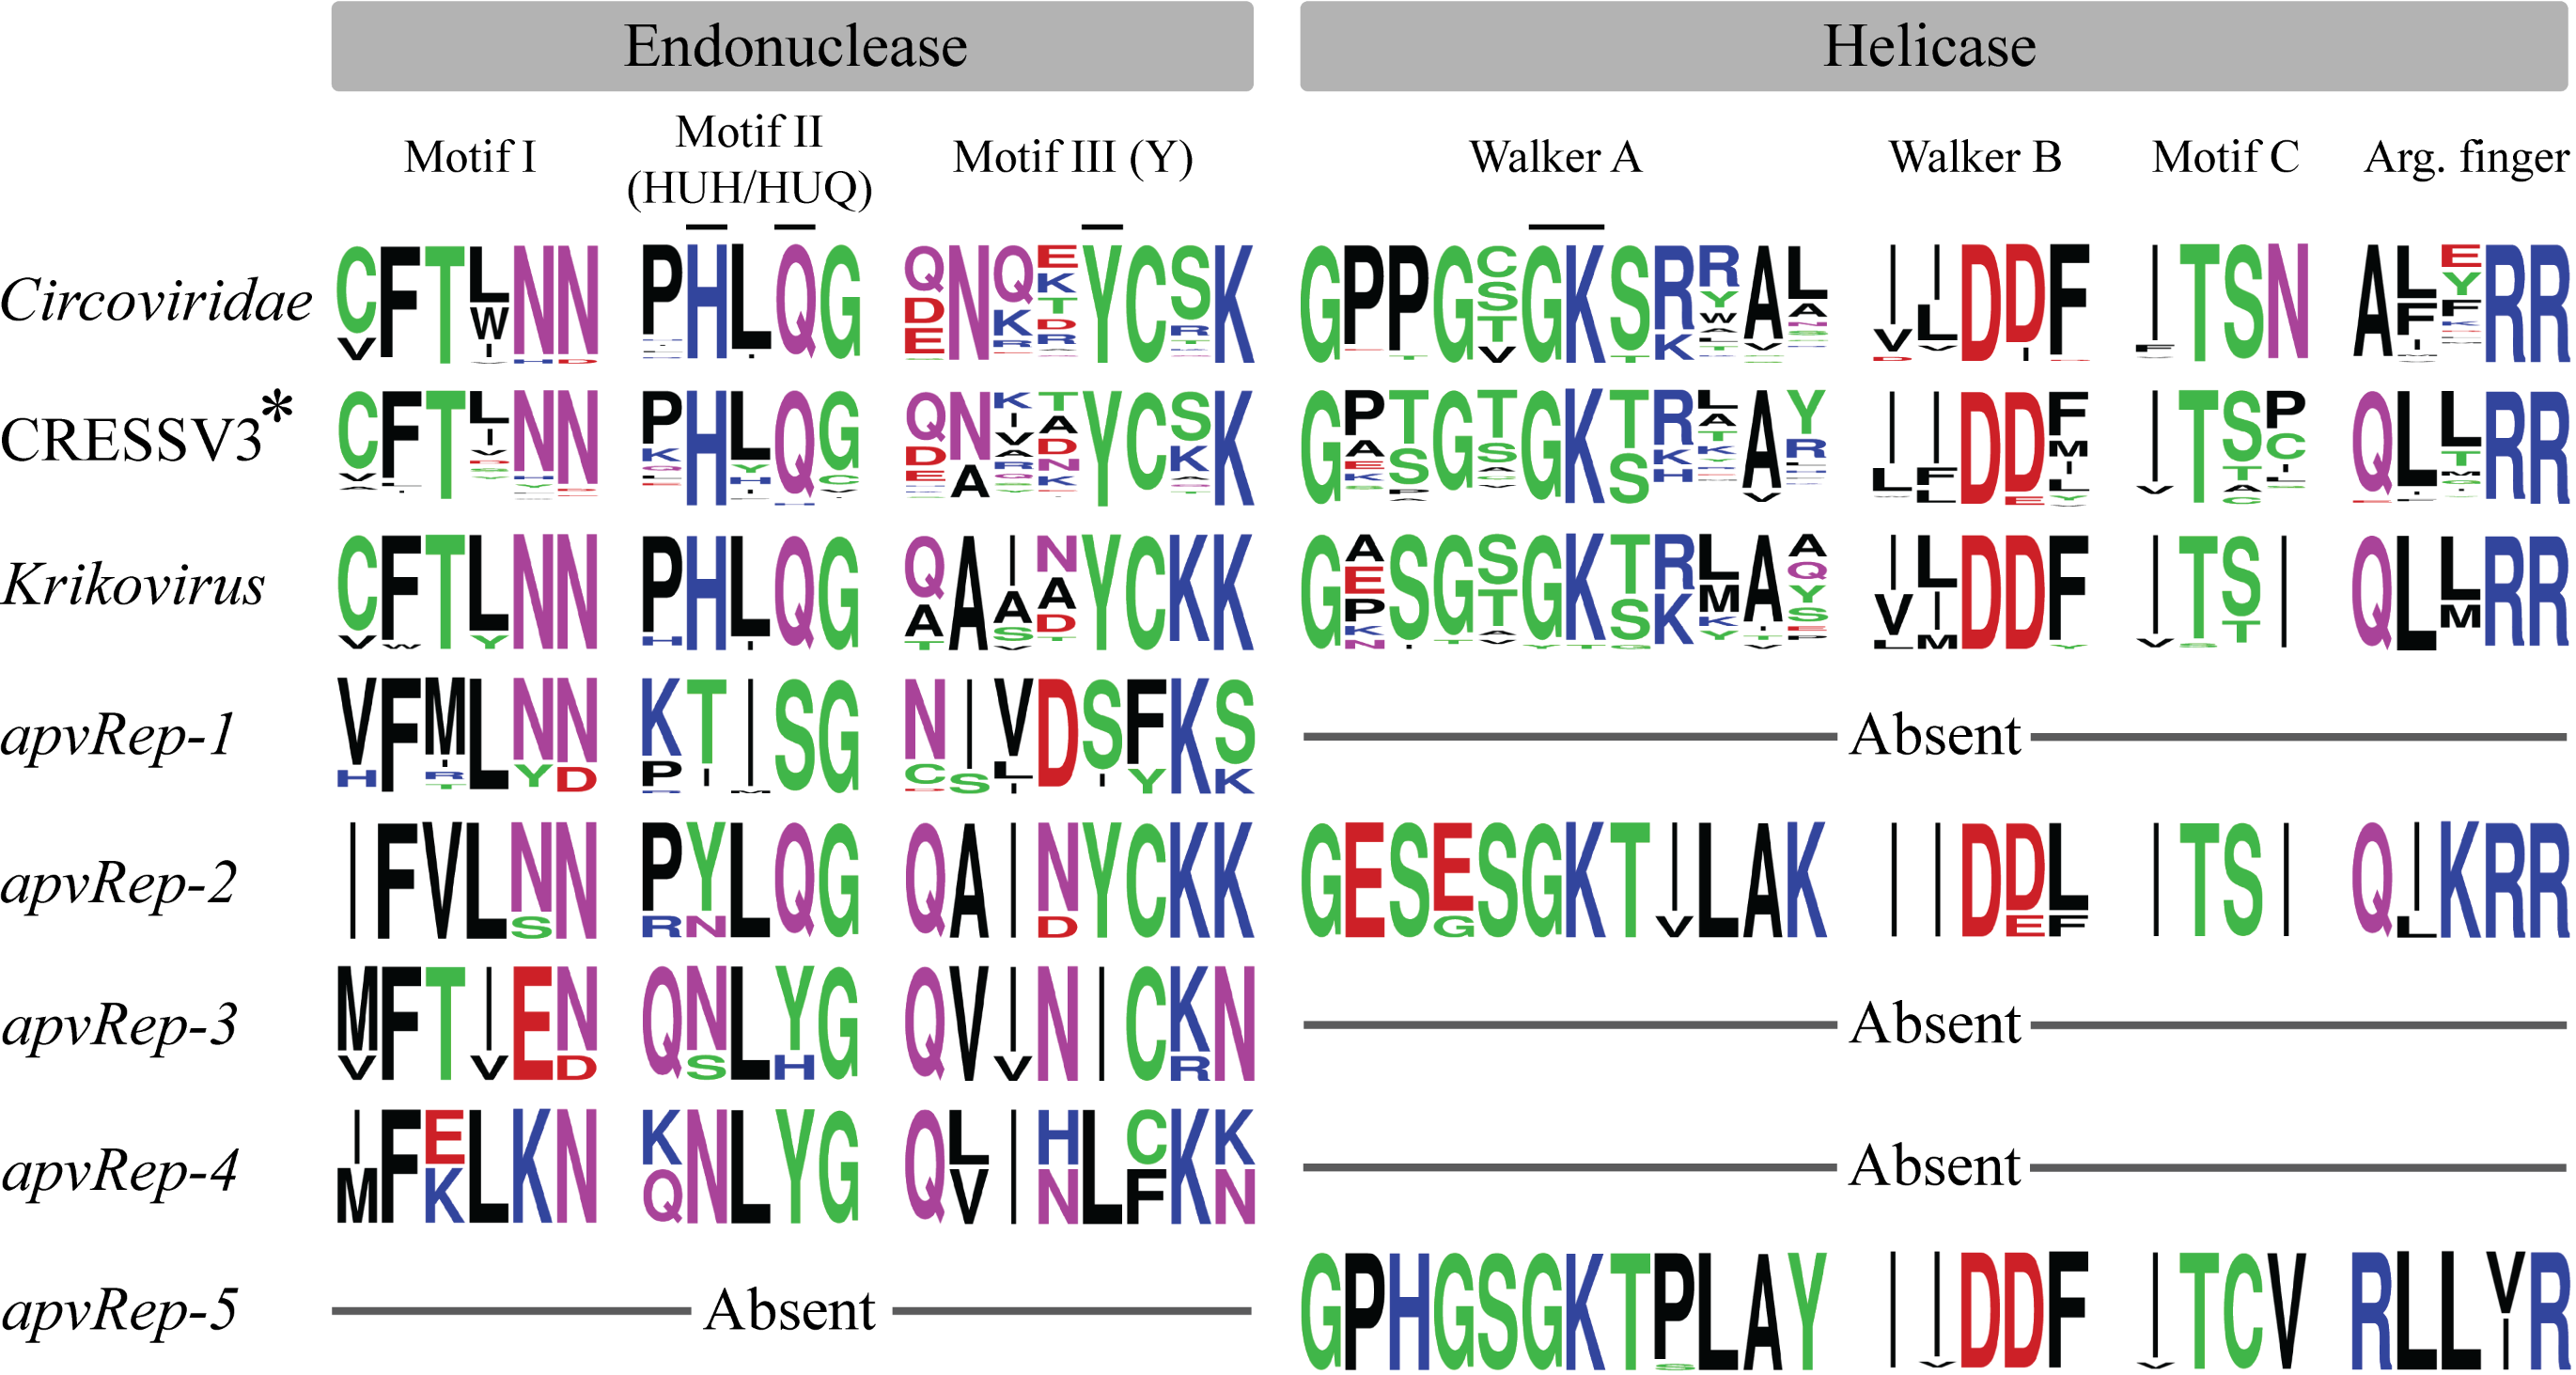
Additional insight into the activity of proteins can be gained by detailed examination of their functional motifs. Here, homologous viral genes were analysed using multiple sequence alignment and the tool WebLogo. Key catalytic motifs found in the endonuclease domain were inactivated in many of the so-called “apvRep” genes, suggesting they have lost this function.